
Graphical Analysis
Overview
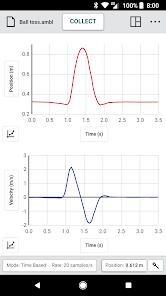
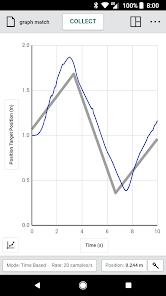
Vernier Graphical Analysis is a highly specialized data visualization and mathematical analysis application developed by Vernier Science Education. Engineered for K-12 and university-level STEM courses, the platform serves as a modern, touch-optimized alternative to legacy software like Logger Pro. The utility allows students to connect external sensors, collect real-world physical data, and generate analytical graphs.
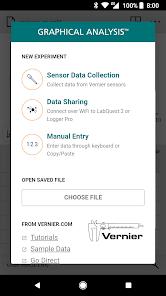
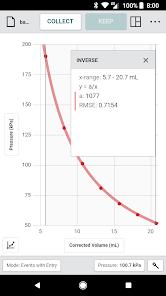
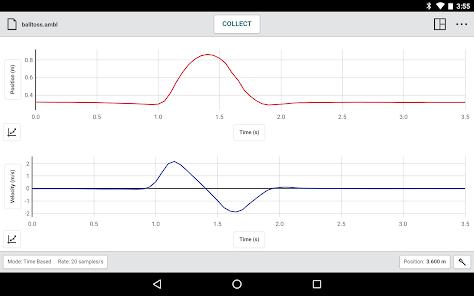
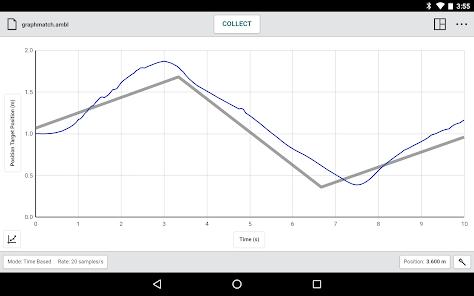
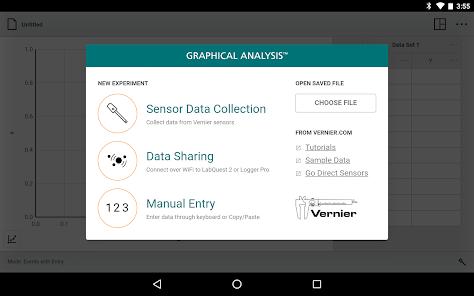
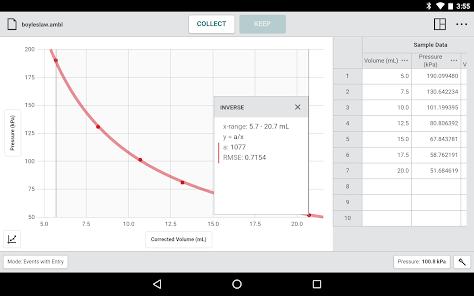
The app's primary value lies in its integration with Vernier’s Go Direct® and LabQuest® hardware ecosystems. Utilizing Bluetooth Low Energy (BLE) or direct USB connections, Graphical Analysis interfaces with sensors to log environmental metrics such as pressure, temperature, force, acceleration, and spectrophotometric absorbance. Students can configure various logging styles, including time-based data collection, event-based tracking, and photogate timing. The app then plots these data streams in real time.
Graphical Analysis is split into a free Basic tier and a paid Pro subscription site license. The Basic tier supports Cartesian coordinate plotting, basic curve fitting, and visual predictions. The Pro version adds advanced tools like calculated columns, error bars to represent uncertainty, live fast Fourier transforms (FFT), built-in library of 45+ experiment guides and videos, and Live Data Sharing. Live Data Sharing is particularly useful in modern hybrid classrooms, allowing an instructor to stream real-time data from a single sensor array directly to multiple students' individual devices.
Pros & Cons
Seamless integration with Vernier Go Direct and LabQuest physical sensors.
Consistent interface across Android, iOS, Windows, and Chrome OS.
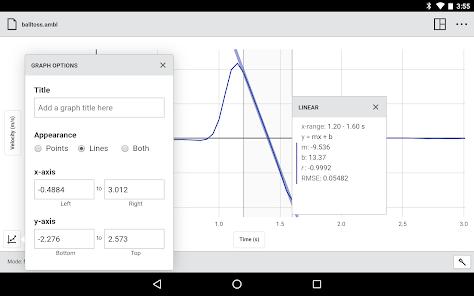
Robust mathematical fits, dynamic tangents, and statistical evaluation tools.
Live Data Sharing capabilities support collaborative and hybrid lab spaces.
The clean, modern user interface is optimized for both tablet screens and touch inputs.
- ✕
Manual data entry can feel clunky compared to automated sensor logging.
- ✕
Advanced visualization features like calculated columns and error bars are locked behind the Pro version.
- ✕
Chromebook users may experience occasional Bluetooth pairing drops during multi-sensor logging.
- ✕
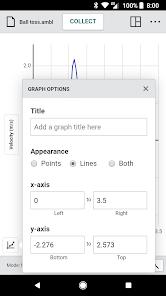
Basic layout functions, such as custom axis labels and text sizes, are sometimes hard to locate.
Download
 Get it on Google Play
  Get it on App Store
 FAQs
Do I need physical Vernier sensors to use this application?
No, students can manually enter coordinates, plot graphs, and run curve fits without external hardware.
What is the difference between Graphical Analysis and Logger Pro?
Graphical Analysis is a touch-optimized app designed for mobile and desktop systems, whereas Logger Pro is a legacy desktop application.
How do I export my laboratory plots to include in a lab report?
Users can export the active workspace as an image file or export the raw numbers as a standard CSV file to open in spreadsheet editors.
Why does the app occasionally fail to detect a Go Direct Bluetooth sensor?
This is often due to system-level Bluetooth conflicts or OS updates. Ensuring the sensor is disconnected from other devices and restarting the app usually resolves this.
Can a school use a single Pro subscription across all student devices?
Yes, Vernier's Pro site license allows K-12 schools or college departments to distribute the app to all faculty and personal student devices.
Hot Reviews
Science teachers praise the platform, noting that transitioning from legacy desktop programs to Graphical Analysis has simplified real-time data collection on student tablets.
Many students complain about the user interface, noting that changing graph titles or custom-labeling axes is unintuitive compared to standard graphing software.
Reviews highlight the app's analytical reliability, reporting that calculated columns and regression fits match standard desktop spreadsheets.